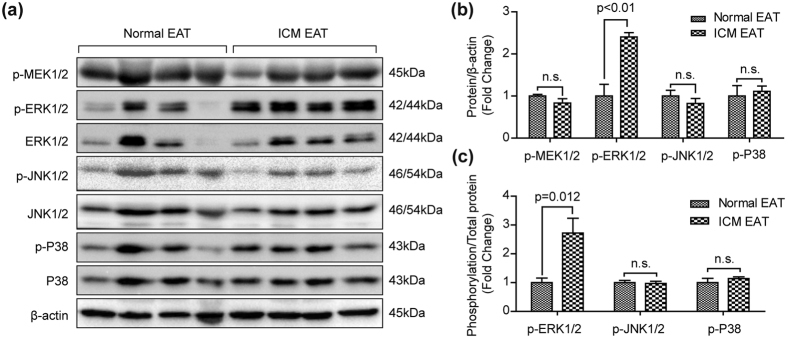
Figure 7. Total and phosphorylation protein levels of MAPK signaling pathway in the EAT.
(a) Total and phosphorylation levels of MEK1/2, ERK1/2, JNK1/2, and P38 were evaluated by western blots (n = 7–8 samples). The β-actin was served as loading control. (b) The gray value ratio of target phosphorylation protein to β-actin; (c) The gray value ratio of target phosphorylation protein to its total protein. n.s. indicated no significance.

