
FIGURE 5.
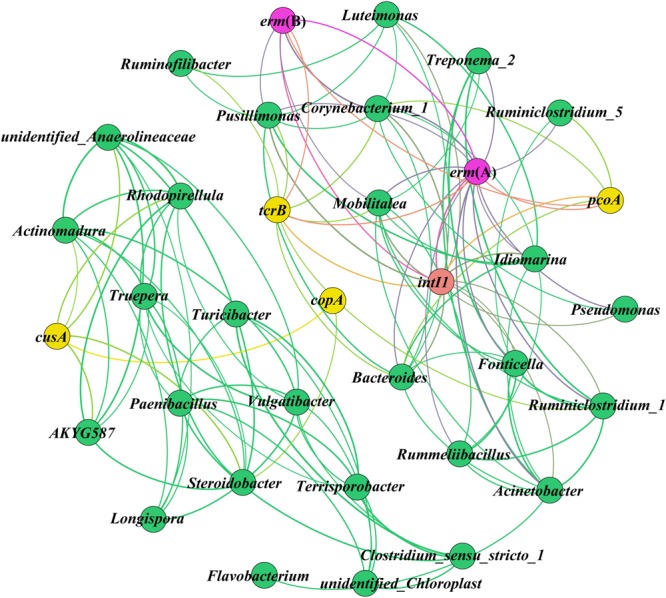
Network analysis showing the co-occurrence of ARGs, CRGs, and intl1 as well as their potential host bacteria. A connection represents a significant positive correlation (p < 0.05) according to Spearman’s rank analysis. The size of each node is proportional to the number of connections, i.e., the degree (details are given in the Supplementary Material S2).