
Figure 2.
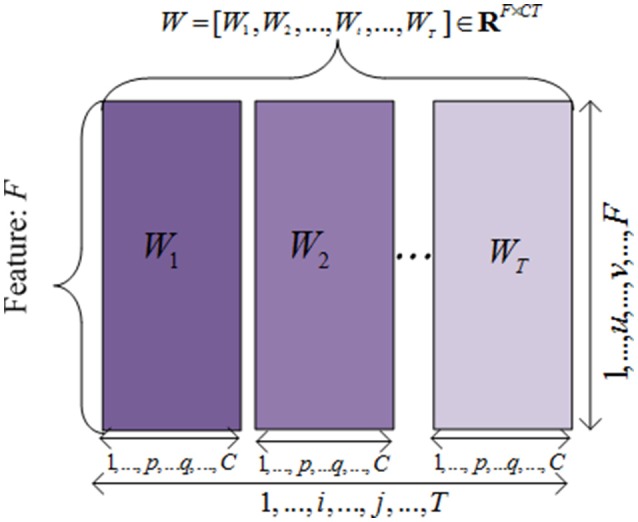
The illustration of the unfolded weight matrices. Each row is correponding to a specific feature vector among different time points, and each column is corresponding to a clinical score vector at one time point.
Official websites use .gov
A
.gov website belongs to an official
government organization in the United States.
Secure .gov websites use HTTPS
A lock (
) or https:// means you've safely
connected to the .gov website. Share sensitive
information only on official, secure websites.
The illustration of the unfolded weight matrices. Each row is correponding to a specific feature vector among different time points, and each column is corresponding to a clinical score vector at one time point.