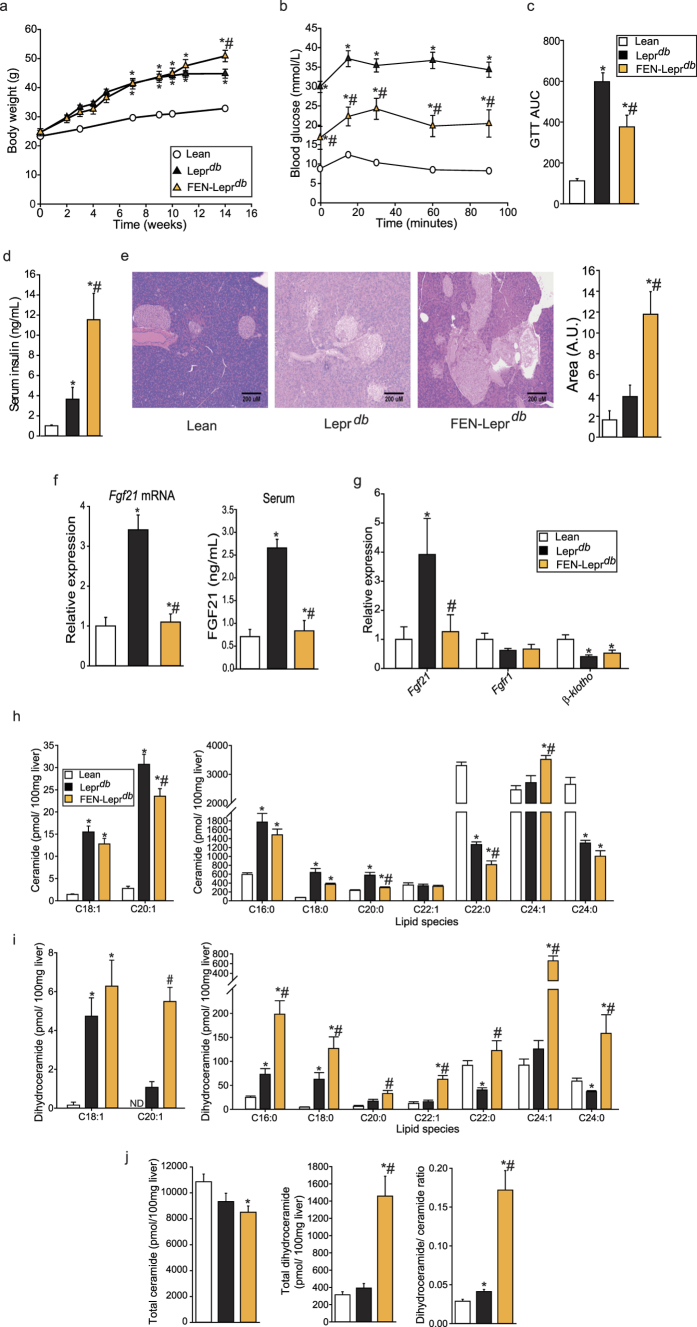
Figure 2. Fenretinide inhibits Fgf21 expression and improves glucose homeostasis without preventing weight gain in Leprdb genetically obese mice.
(a) Body weight of C57BL/6 lean mice on chow (lean, n = 8; error bars too small to be shown clearly) and C57BL/6 Leprdbmice on 10% fat (Leprdb, n = 7) or 10% fat diet +FEN (FEN-Leprdb, = 7). (b) Glucose (1 mg/g body weight) Tolerance Test (GTT) and (c) AUC at week 4. (d) serum insulin levels at the end of the study, following a 5 h fast. (e) Representative photos of haematoxylin and eosin staining of pancreas sections (10x magnification) and quantification of pancreatic islet size (n = 3 per group). (f) Hepatic gene expression and serum levels of FGF21. Gene expression was normalised to Nono. (g) PG-WAT gene expression, normalised to yWhaz. Significant differences were determined by one-way ANOVA followed by post-hoc tests or student’s t-test for PG-WAT Fgf21 FEN-Leprdb vs Leprdb and Leprdb vs lean groups and β-klotho FEN-Leprdb vs Leprdb and Leprdb vs lean groups. Differences are marked *p < 0.05 vs lean or #p < 0.05 vs Leprdb. Quantification of ceramide (h) and dihydroceramide (i) species in liver. (j) Total liver levels of ceramide, dihydroceramide and the dihydroceramide/ceramide ratio. Significant differences were determined by one-way ANOVA followed by post-hoc tests or student’s t-test for ceramides: C18:0 FEN-Leprdb vs Leprdb and FEN-Leprdb vs lean groups, C20:0 FEN-Leprdb vs Leprdb and FEN-Leprdb vs lean groups, C24:1 FEN-Leprdb vs Leprdb groups; dihydroceramides: C16:0 FEN-Leprdb vs Leprdb and Leprdb vs lean groups, C18:0 FEN-Leprdb vs Leprdb and Leprdb vs lean groups, C20:1 FEN-Leprdb vs Leprdb groups, C20:0 Leprdb vs lean groups, C24:0 FEN-Leprdb vs lean and Leprdbvs lean groups. Differences are marked *p < 0.05 vs lean or #p < 0.05 vs Leprdb.

