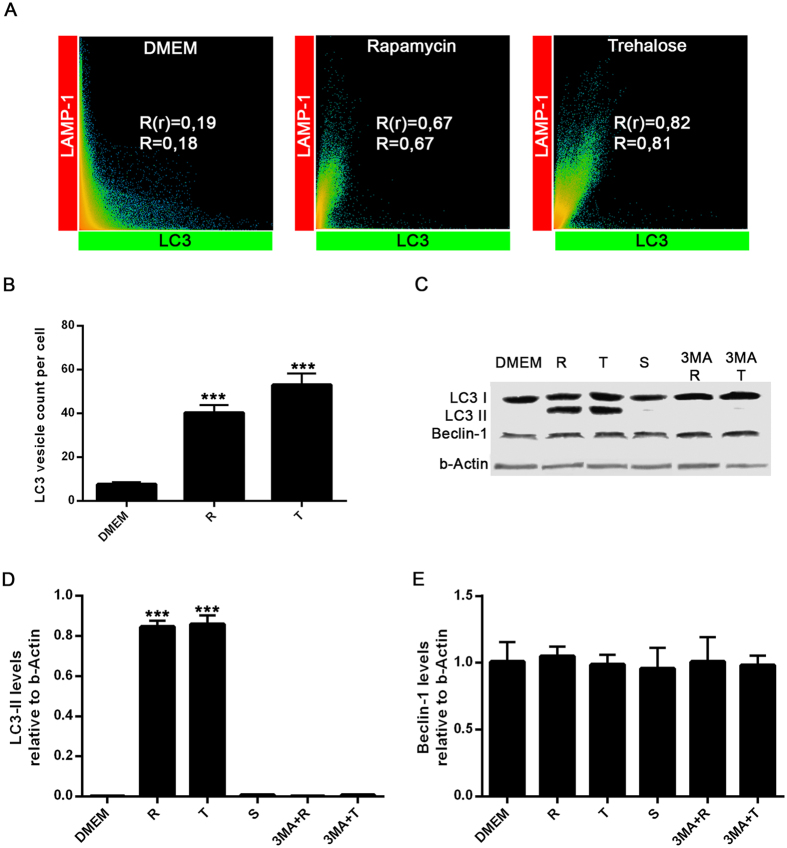
Figure 2. Evaluation of LC3-II and Beclin-1 levels in BV2 microglial cells.
(A) Scatter plots represent colocalization analyses between LC3B and LAMP-1 using SVI Huygens Essential 14.1 software. Pearson coefficient (R) and Overlap coefficient (R[r]) are listed. (B) LC3 positive vesicles in unstimulated BV2 cells or treated with rapamycin (100 nM) or trehalose (30 mM) were determined using ImageJ particle counting plugin after cell deconvolution (n = 10). (C) BV2 cells incubated with 3-MA (2 mM; a specific inhibitor of autophagy) for 1 h at 37 °C were cultured in the presence or absence of rapamycin (100 nM) or trehalose (30 mM) for 24 h at 37 °C. Cells were lysed, and LC3B, Beclin-1 and β-Actin were examined by Western immunoblotting. Quantification of LC3-II (D) or Beclin-1 (E) from B relative to β-Actin by densitometry (one-way ANOVA followed by Post-Hoc Dunnet’s test; n = 3). Error bars represent SEM (*P < 0.05; **P < 0.01; ***P < 0.001).

