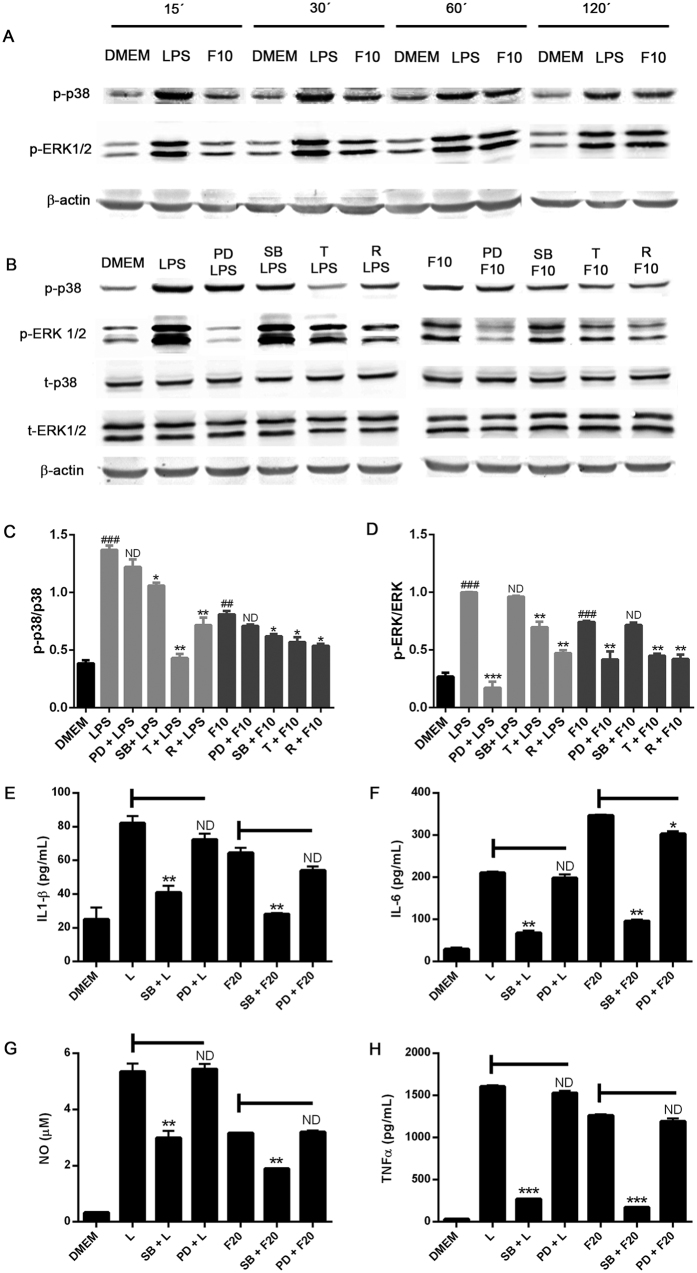
Figure 5. Autophagy modulation of p38 and ERK signalling in LPS and α-synuclein-stimulated BV2 microglial cells.
(A) BV2 cells were stimulated with LPS (0,5 ug/mL) or alpha-synuclein fibers (10 uM) for 15 to 120 minutes. (B) BV2 cells were cultured in the presence or absence of PD98059 (50 uM) SB202190 (20 uM) for 1 h or treated with rapamycin (100 nm) or trehalose (30 mM) for 24 h. After that, microglial cells were stimulated with LPS (0,5 ug/mL) or alpha-synuclein fibers (10 uM) for 30 and 60 minutes, respectively. Cells were lysed and p38, p-p38, ERK1/2, p-ERK1/2 and b-actin levels were analysed by Western immunoblotting. Quantification by densitometry of p-p38 (C) or p-ERK1/2 (D) from B relative to p38 or ERK1/2, respectively. (One-way ANOVA followed by Post-Hoc Dunnet’s test; n = 3). Error bars represent SEM (*P < 0.05; **P < 0.01) (###P < 0.001 compared to DMEM). BV2 cells were cultured in the presence or absence of SB (20 uM) or PD (50 uM) for 1 h at 37 °C. After that, microglial cells were stimulated with LPS (0,5 ug/mL) or α-synuclein fibers (20 uM) for 24 h and the supernatants were isolated and analyzed by ELISA, for the measurement of IL-1β (E), IL-6 (F) and TNF-α (H), respectively. NO levels (G) were determined by Griess assay. Results were analyzed by one-way ANOVA followed by Post-Hoc Dunnet’s test; n = 3. Error bars represent SEM (***P < 0.001). L = LPS, R = rapamycin, T = trehalose, F10 = alpha-synuclein fibers 10 uM, F20 = α-synuclein fibers 20 uM.

