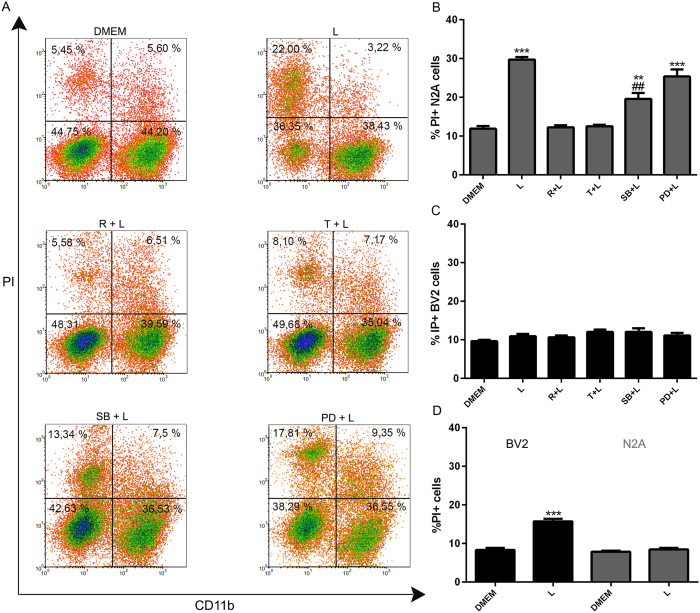
Figure 6. Modulation of LPS-induced neuronal cell death by inducing microglial autophagy.
(A) BV2 and N2A cells were co-cultured in a 1:1 ratio and left untreated or stimulated with LPS for 48 h. Firstly, BV2 microglial cells were treated with rapamycin, trehalose, SB202190 (20 uM) or PD98059 (50 uM). After 24 h, BV2 cells were co-cultured with N2A cells and stimulated with LPS for 48 h. After that, cell death was evaluated using propidium iodide (PI) combined with anti-CD11b staining and subsequent flow cytometric analysis. (B–D) Percentages of neuronal CD11b−/IP+ and microglial CD11b+/IP+ cell death were determined and analyzed statistically by one-way ANOVA followed by Post-Hoc Dunnet’s test; n = 3. Error bars represent SEM (***P < 0.001, **P < 0.01); (##P < 0.01 compared to LPS) (L = LPS, R = rapamycin, T = trehalose). (D) BV2 cells alone or N2A alone treated with LPS.

