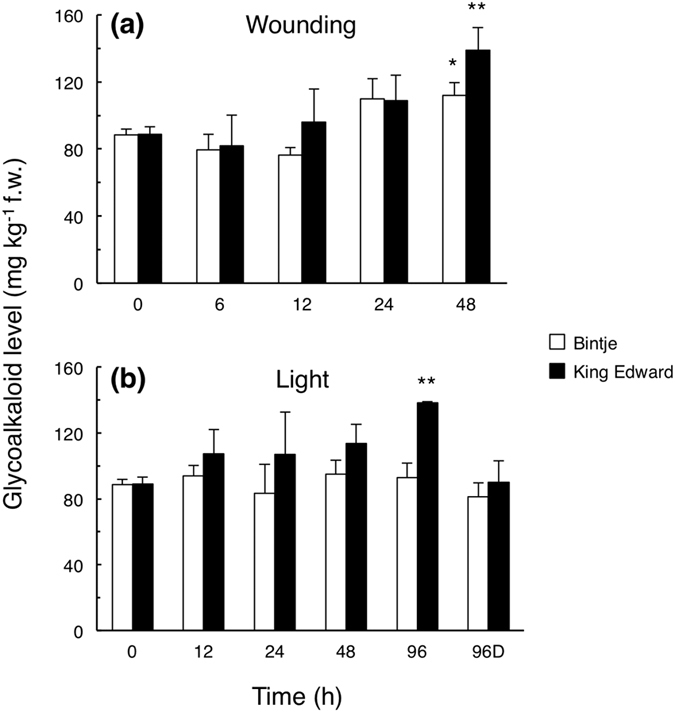
Figure 1. Glycoalkaloid levels in potato tubers subjected to wounding or a light exposure.

Glycoalkaloid levels in tuber cross-sections were analysed at different time points after wounding (a), or continuous white light exposure (b), in Bintje (white bars) and King Edward (dark bars). 96D indicates a control kept 96 h in darkness. Mean glycoalkaloid value ± range from the sum of α-chaconine and α-solanine, as determined by HPLC-UV in biological duplicates for each cultivar. Asterisks indicate a regression analysis (ANOVA) of the cultivar response, significantly different from zero at p < 0.05 (*) or at p < 0.01 (**).
