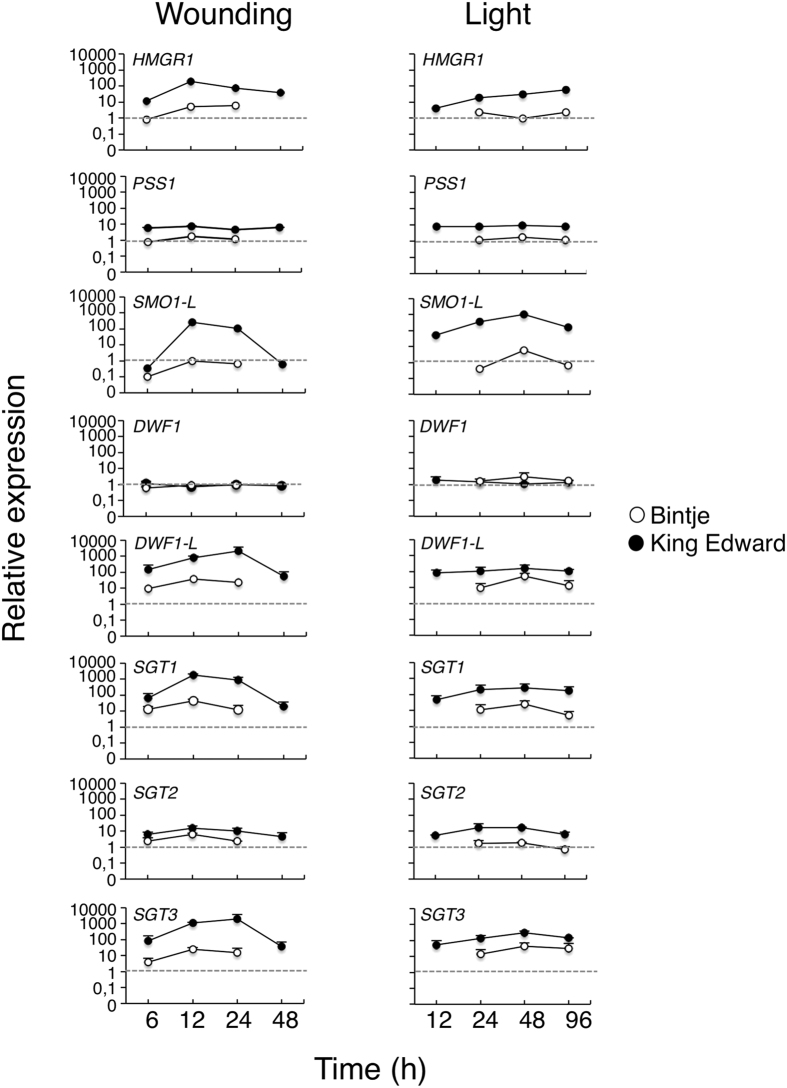
Figure 5. Quantitative real-time PCR analysis of gene expression in potato tubers subjected to wounding or a light exposure.
Gene expression was analysed in tuber cross-sections by QPCR, normalized using potato β-TUBULIN as an internal reference, and expressed to the normalized expression level in non-treated samples (0 h). Average value ± range of two biological replicates from Bintje (open circles) and King Edward (dark circles) analysed in duplicate or triplicate. Gene abbreviations are given in Supplementary Table S10.

