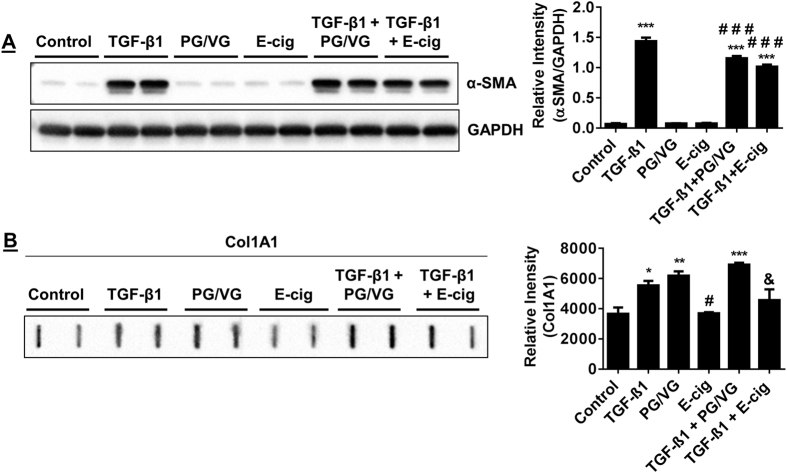
Figure 5. TGF-β1 induced α-SMA and Col 1A1 abundance in fibroblasts is suppressed by e-cig condensate.
Immunoblotting of α-SMA and Col 1A1 levels in HFL-1 incubated with TGF-β1, PG/VG, E-cig, TGF-β1 with PG/VG, TGF-β1 co-treated with E-cig. (A) Representative immunoblot for α-SMA in HFL-1 lysates after cell treatments for 72 hrs; TGF-β1, PG/VG, E-cig, TGF-β1 co-treated with PG/VG, TGF-β1 co-treated with E-cig. (B) Slot blot detection of Col 1A1 in conditioned media from HFL-1. Densitometry analysis represented in arbitrary units. Data are mean ± SEM. Data are a representative of at least three reproducible experiments. *p ≤ 0.05, **p ≤ 0.01, ***p ≤ 0.001 significant compared to control group; #p ≤ 0.05, ###p ≤ 0.001 significant compared to TGF-β1 group; & p ≤ 0.05 significant compared to TGF-β1 + PG/VG group. E-cig, e-cigarette; PG, propylene glycol; VG, vegetable glycerin.

