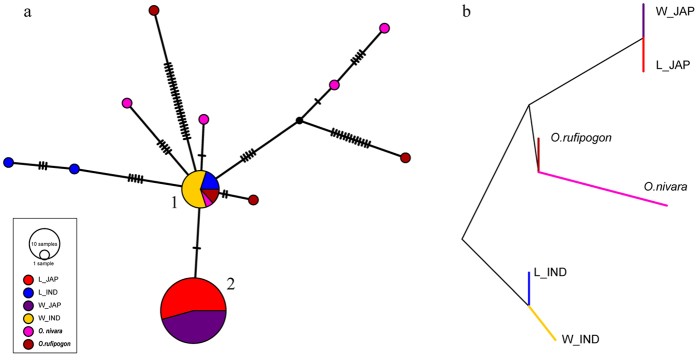
Figure 5. Haplotype network and population splits of the mitochondrial genome suggested by genome wide variations.
(a) Circle size is proportional to the number of samples within a given haplotype, and dashes between haplotypes represent unobserved, inferred haplotypes. Lines between haplotypes represent mutational steps between alleles. Colors denote rice designation: dark red, O. rufipogon; orange and blue, indica, red and purple, japonica, pink, O. nivara. (b) Population splits based on the six groups. L/W_IND: indica type in landrace or weedy rice, L/W_JAP: japonica type in landrace or weedy rice.

