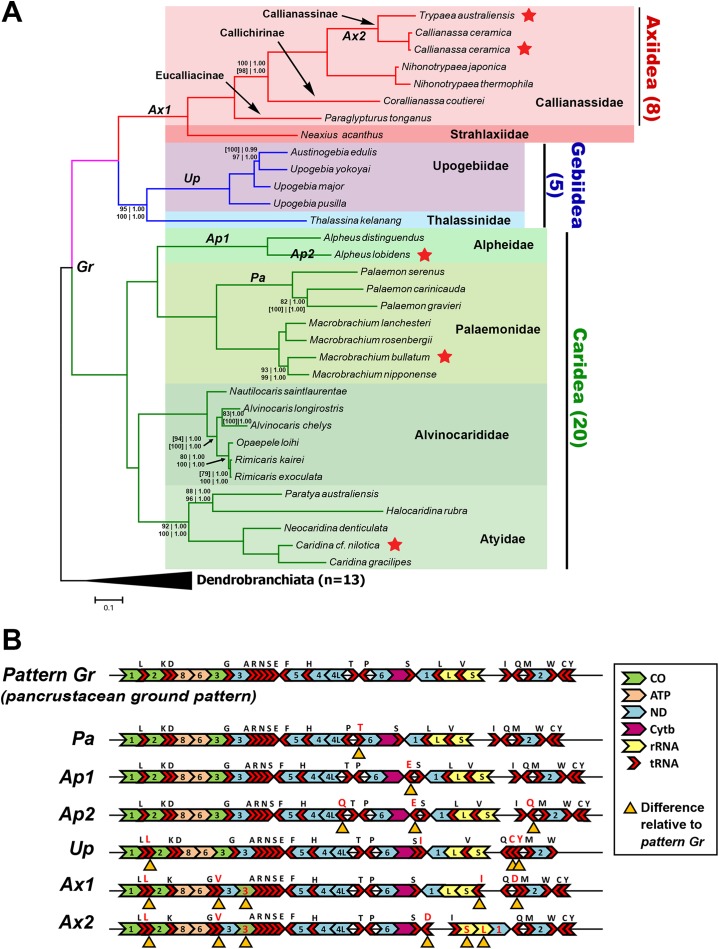
Figure 2. Phylogenetic relationships and gene order rearrangements within Axiidea, Gebiidea and Caridea.
(A). Phylogenetic tree with support values indicated at each node (top, l-r: ML and BI support for PCG (aa) + 12S + 16S dataset), bottom, l-r: ML and BI support for PCG (nt) + 12S + 16S dataset). Square brackets [ ] around a value indicate that the shown topology is in conflict with that constructed by the specific dataset. If values are absent at a node, maximum support was found for that node based on all phylogenetic inference methods and datasets. Topology shown was inferred from Bayesian analysis of PCG (aa) + 12S + 16S dataset. Codes on branches (Gr, Pa, Ap1, Ap2, Up, Ax1, Ax2) correspond to gene order pattern listed in B while red stars indicate mitogenomes sequenced in this study. (B). Gene order of various groups. Yellow triangles under genes indicate differences in arrangement compared to the ground pancrustacean pattern.

