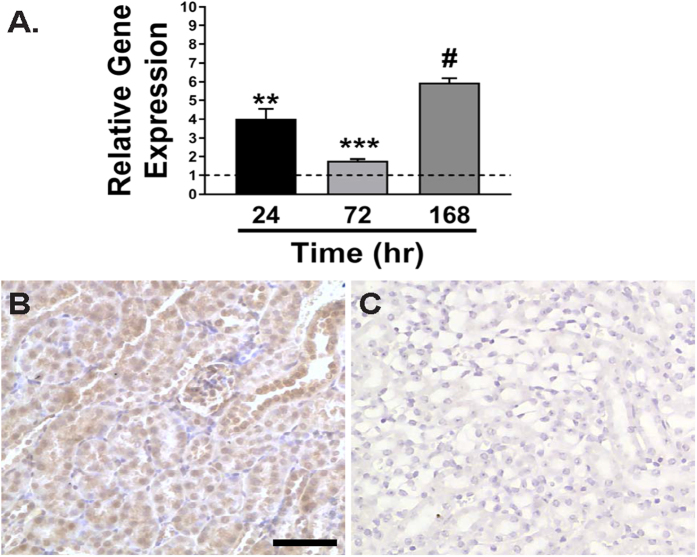
Figure 1. Transcript expression profile of Trip13 and localization of TRIP13 in mouse kidneys.
(A) Total RNA was isolated from the contralateral and IRI-injured kidneys from wild-type Trip13+/+ mouse kidneys at 24 (black), 72 (light grey) and 168 hours (dark grey). Quantitative RT-PCR was performed using specific TaqMan primers targeted to Trip13 mRNA. n = 3 kidneys/time point. **P < 0.01, ***P < 0.005, #P < 0.001 significant difference between IRI versus sham at each time point. (B) Representative image for TRIP13 localization in a mouse kidney section by immunohistochemistry using a selective TRIP13 antibody. (C) Negative control for TRIP13 immunostaining where TRIP13 antibody was not added to the tissue sections. Scale bar = 60 μm (B,C).

