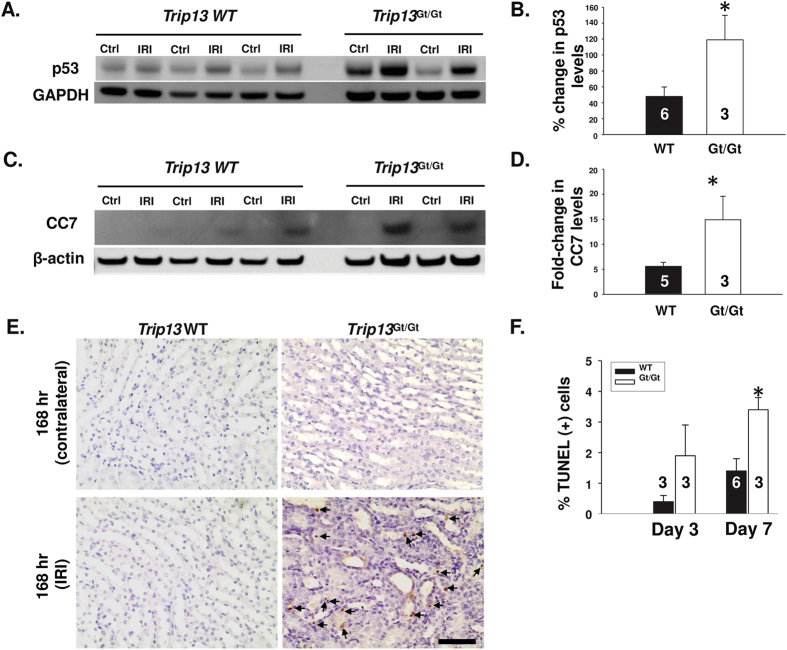
Figure 4. p53 induction and promotion of apoptosis following renal IRI due to TRIP13 deficiency.
Immunoblot analysis of (A) p53 and (C) cleaved caspase‐7 in contralateral (Ctrl) and IRI kidney lysates harvested from different Trip13+/+ and Trip13Gt/Gtmice after 168 hours following IRI. GAPDH or β-actin was used as a loading control. (B and D) Ratio of the band intensities for (A) p53 and (C) CC7 between the injured: contralateral kidneys from the same mice were graphed. (E) Detection of TUNEL-positive cells in the kidney. Immunohistochemistry was performed to detect TUNEL‐ positive cells in contralateral and IRI-treated kidney sections at 168 hours from the WT and hypomorph Trip13Gt/Gtmice. Arrowheads indicate the TUNEL-positive nuclei. Scale bar = 60 μm. The number of TUNEL‐positive cells was counted using 10 different images at a magnification of 40X from multiple kidneys, and graphed as a percentage of TUNEL‐positive cells. The number of animals analyzed per group was shown in the bars. *P < 0.05 significant difference between the groups at day 7. (F) Quantitation of apoptotic tubular epithelial cells were counted and graphed from mice kidneys after 72 and 168 hours after IRI. *P < 0.05 significant difference between the groups at day 7.

