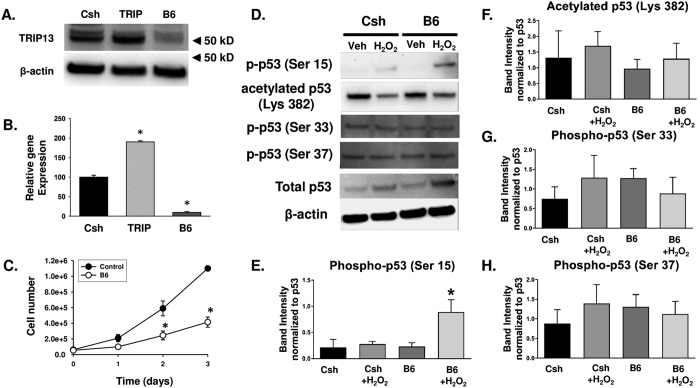
Figure 5. Effects on cell number and p53 activation in IMCD cells exposed to H2O2 depending upon the reduced levels of TRIP13.
(A,B) Representative data of TRIP13 protein (A) and Trip13 mRNA (B) using immunoblot and quantitative RT‐PCR analysis, respectively, from IMCD-3 cells transduced with either Trip13 cDNA (Trip), control short hairpin RNA (Csh) or Trip13-specific shRNA (B6). Arrows in (A) indicate protein size marker. β‐actin was used as a loading control for the immunoblot analysis, and 18S was used as a normalization control for the quantitative RT-PCR analysis. (C) Cell number analysis. IMCD cells expressing control shRNA (Csh) or Trip13-specific shRNA (B6) were plated and counted over a 72 hour period by hemocytometry. n = 3 different experiments performed in triplicate per time point and group. **P < 0.01 significant difference between groups. (D–H) Immunoblot analyses of various post-translational changes to p53 normalized to total p53 levels following 8.8 μM hydrogen peroxide (H2O2) versus vehicle (veh) treatment in Csh and B6 IMCD cells. Quantification of (E) phospho-p53 at Serine 15, (F) acetylated p-53 at Lysine 382, (G) phospho-p53 at Serine 33, and (H) phospho-p53 at Serine 37 were analyzed from 3 independent experiments. *P < 0.05 significant difference between B6 and Csh cells following H2O2 treatment.

