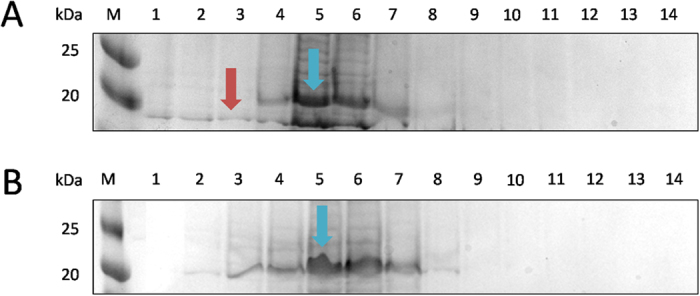
Figure 3. Elution profile of WT-HBc monomers from Ni2+-chelate affinity chromatography column (cropped gels).

A column with 6 ml of cOmplete™ His-Tag Purification Resin was equilibrated with 3-times bed-volume (18 ml) of the dissociation buffer. The column was loaded with the protein probe and washed with 18 ml dissociation buffer. Bound proteins were eluted with 14 ml of elution buffer and collected in 1 ml fractions. The aliquots of each fractions were subjected to SDS-PAGE gel electrophoresis and stained with Coomassie Brilliant Blue. M, marker in kDa; Numbers 1–14 represent aliquots of the respective elution fractions for (A) WT-HBc (C) or (B) WT-HBc (I) monomers. Blue arrows represent WT-HBc monomers (21 kDa). Higher number of fractions (7 fractions, lane 2–8) were collected in case of WT-HBc (I) compared to WT-HBc (C) (5 fractions, lane 4–8). Some unknown protein bands were observed at molecular weight lower than 20 kDa (red arrow).
