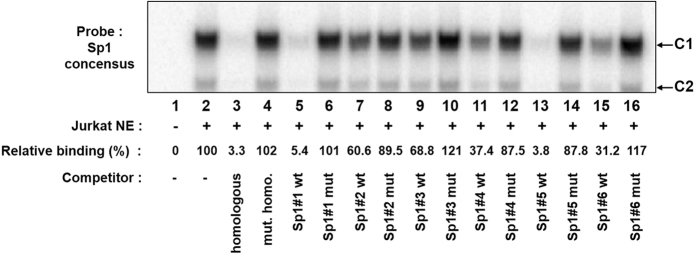
Figure 3. Ranking of the LTR Sp1-binding sites with respect to their affinity for Sp1.
The Sp1 binding site consensus (lanes 1 to 16) probe was incubated alone (lane 1) or with nuclear extracts (10 μg) from Jurkat T cells in the absence of competitor (lane 2) or in the presence of a molar excess (30 fold) of a competitor corresponding to the homologous consensus Sp1 binding site (lane 3), to the mutated consensus Sp1 binding site (lane 4), or to the indicated wild-type (lanes 5, 7, 9, 11, 13, 15) or mutated (lanes 6, 8, 10, 12, 14, 16) HTLV-1 Sp1 binding site. The figure shows the specific retarded bands of interest, which are indicated by arrows. The terms C1 and C2 refer to complexes 1 and 2. Quantification of EMSAs was performed with a PhosphorImager and is shown for the C1 complex. The results are expressed as a percentage of binding in comparison to binding in the absence of competitor oligonucleotide.

