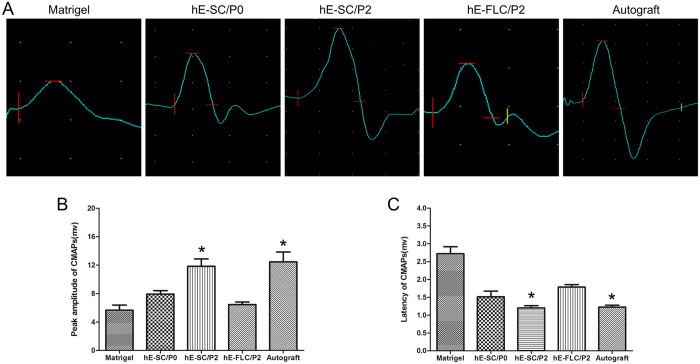
Figure 4. Electrophysiological evaluation of the injured site at 12 weeks after surgery.
(A) Representative CMAP recordings of electrophysiological evaluation. Histograms show the peak (B) and latency periods (C) of the CMAPs. Data are presented as the mean ± standard error of three independent experiments, *P < 0.05; compared to the other three groups (Matrigel, hE-SCs/P0 and hE-FLs/P2).

