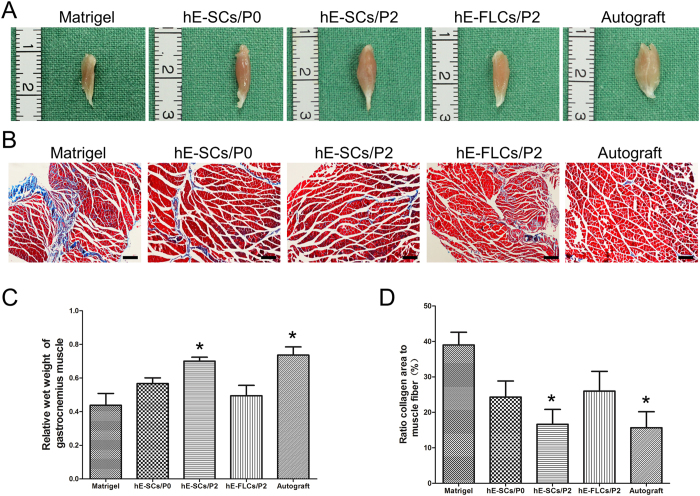
Figure 7. Wet weight and morphological analysis of the gastrocnemius muscle from the affected limb at 12 weeks after surgery.
(A) Macroscopic view of the gastrocnemius muscles. (B) Masson trichrome staining of gastrocnemius muscle in five groups. Scale bars = 200 μm. (C) Quantification and statistical analysis of the wet weight ratios of gastrocnemius muscle. (D) Ratio of collagen area to the muscle fiber. Data are shown as the mean ± SD, *P < 0.05, compared to the other three groups (Matrigel, hE-SCs/P0 and hE-FLs/P2). Abbreviations: hE-SCs, human eyelid adipose-derived Schwann cells; hE-FLCs, human eyelid adipose-derived fibroblast-like cells.

