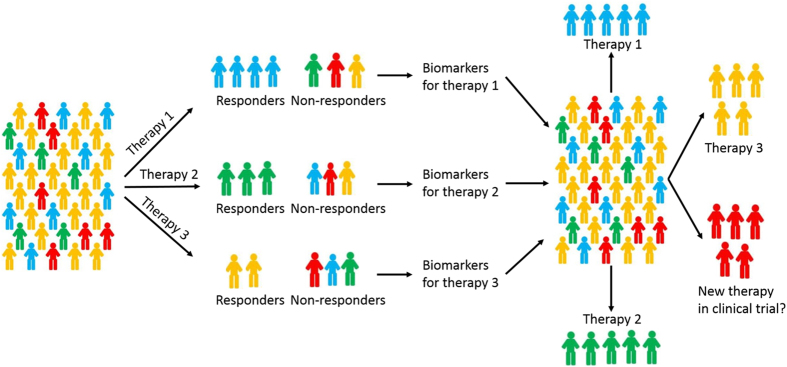
Figure 1. Schematic illustration of our strategy for developing personalized treatment from multiple patient cohorts with different treatments.
All the patients received one of three therapies. Each group has responders and non-responders. From each treatment group, we identify biomarkers and build predictive models for selecting responders for the corresponding treatment. The three models are validated through cross-validation, where each patient is evaluated using the model trained without using that patient’s information. To assess the overall performance of the three sets of biomarkers and corresponding models, all the patients are evaluated by all the three models and the therapy with the highest probability of giving pathological complete response (pCR) is assigned to the patient. The expected probability of pCR is calculated and compared with the actual pCR, which can be either the average pCR of the three regimens or the highest pCR of the three regimens. Here all the patients are assigned a therapy for comparison purpose since all the patients in reality received one of the three therapies. In practice, patients who are predicted to not respond well to any of the therapies may opt not taking any of them and try a new therapy. Note, the numbers of colored human figures have no actual meaning. In reality, there are patients who respond to more than one regimen. The responders in this figure represent those who have the best response for the corresponding regimen.

