
Figure 2. Observed pCR rates vs. predicted probabilities.
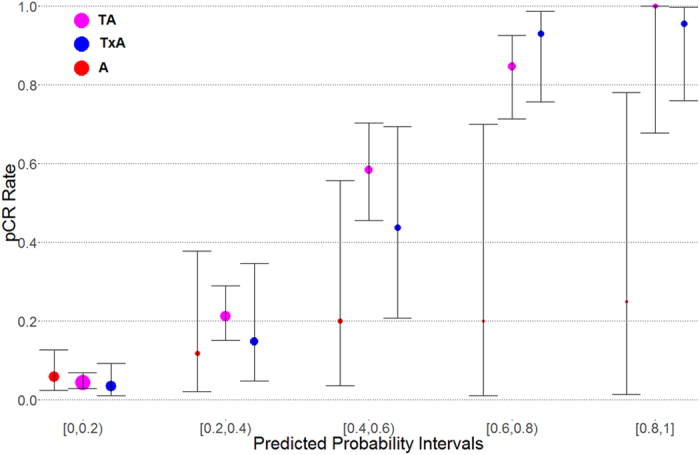
The predicted probabilities for each regimen are divided into 5 equal length intervals (x-axis). For each interval and each regimen (5 * 3 combinations), the observed pCR rate is calculated by dividing the number of pCR patients with the total number of patients for the particular interval-regimen combination. The predicted probabilities correlate strongly with observed pCR rate in general. However, they differ significantly for some regimens and probability intervals. The three points at each interval for three regimens are scattered around the middle point for visual clarity. The bars show confidence intervals and the sizes of the points are proportional to the number of patients in that particular group.