
Figure 4. The boxplot for predicted probabilities of paclitaxel-sensitive and resistant groups.
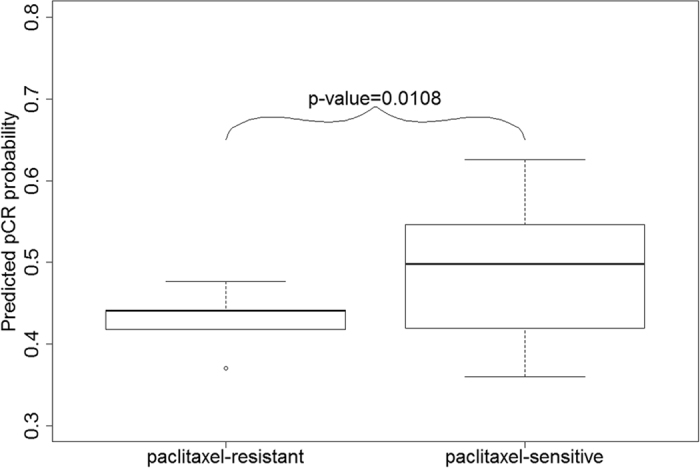
The predicted probabilities of pCR for paclitaxel-sensitive cell lines are significantly higher (p-value = 0.0108) than those of the paclitaxel-resistant cell lines.