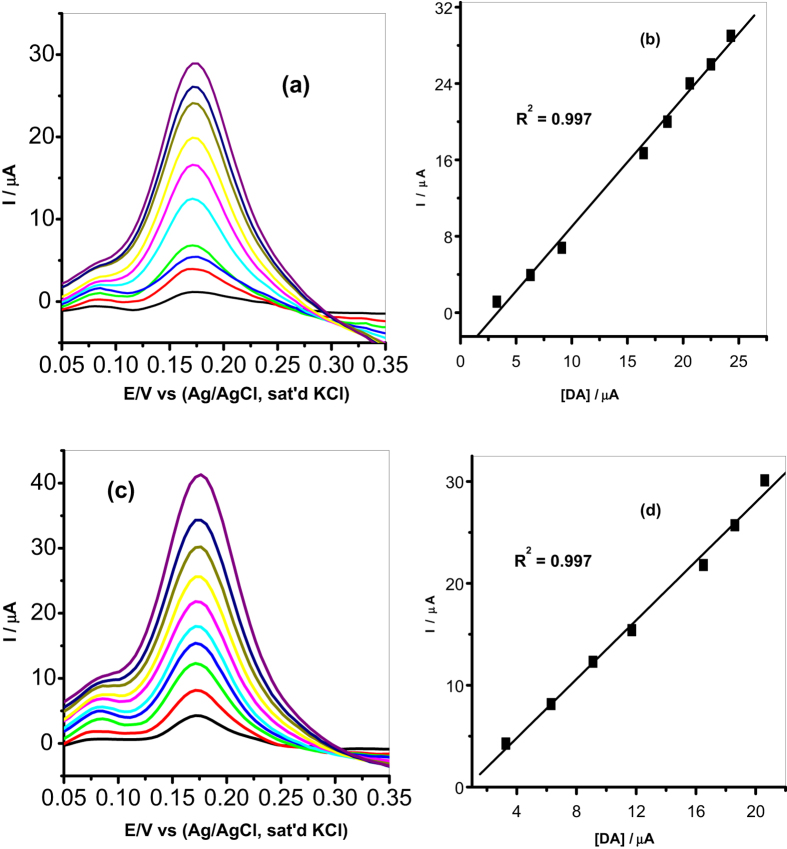
Figure 13.
Differential pulse voltammograms of (a) MWCNT/Fe3O4/2,3-Nc and (c) MWCNT/Fe3O4/29H,31H-Pc modified electrodes in pH 7.2 PBS containing different concentrations of DA (3.27, 6.3, 9.11, 11.7, 14.2, 16.5, 18.6, 20.6, 22.5 and 24.3 μM). (b,d) Are their respective plots of peak current vs. DA concentration.

