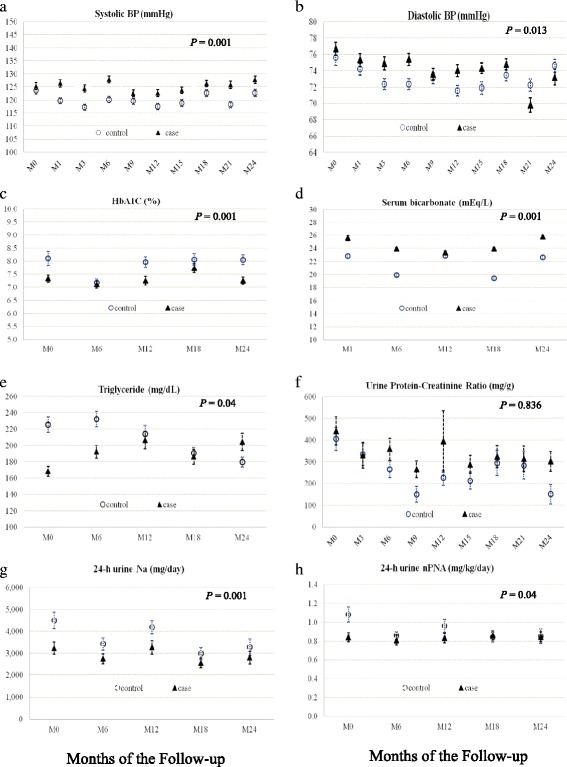
Fig. 3.

Changes in clinical and laboratory parameters during the follow-up period. GEE analyses were used to determine mean differences over time of clinical outcomes and laboratory parameters between the two groups. Change in systolic BP (a), diastolic BP (b), hemoglobin A1C (c), serum bicarbonate (d), serum triglyceride (e), urine protein-creatinine ratio (f), 24-h urine normalized protein nitrogen appearance (g), 24-h urine sodium (h) between intervention group and control group during the follow-up period
