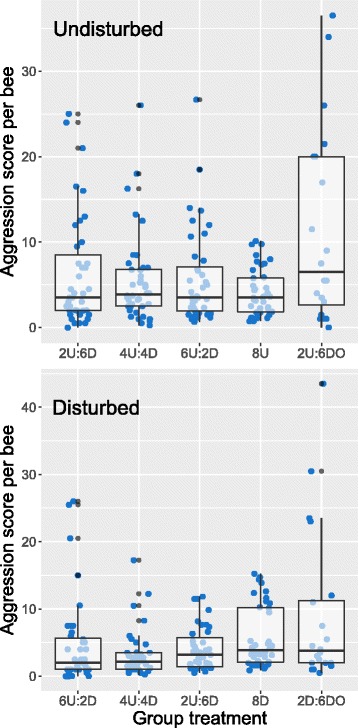
Fig. 2.

Analysis of aggression as a function of social group. Undisturbed bees showed relatively consistent aggression levels regardless of social group composition while disturbed individuals significantly modulated their aggression in response to social group composition (top and bottom panels, respectively). “U”, “D”, and “DO” indicate the number of undisturbed, disturbed, and one-day-old bees in each group, respectively. A post-hoc analysis of disturbed bee behavior, using a Wilcoxon Test for each pair, significantly distinguished three treatment categories, 6U:2D and 4U:4D, 2U:6D, and 8D and 2D:6DO. Box hinges show the 1st and 3rd quartiles, whiskers indicate 1.5*IQR from the hinge, and the central tendency line indicates the median. Data points represent scores for individual replicates
