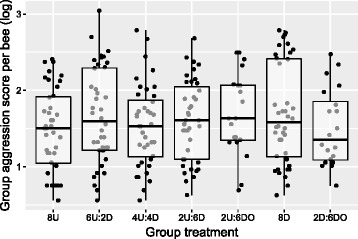
Fig. 4.

Group aggression score as a function of social group. Total group aggression score did not significantly vary as a function of social group composition. Box hinges show the 1st and 3rd quartiles, whiskers indicate 1.5*IQR from the hinge, and the central tendency line indicates the median. Data points represent scores for individual replicates
