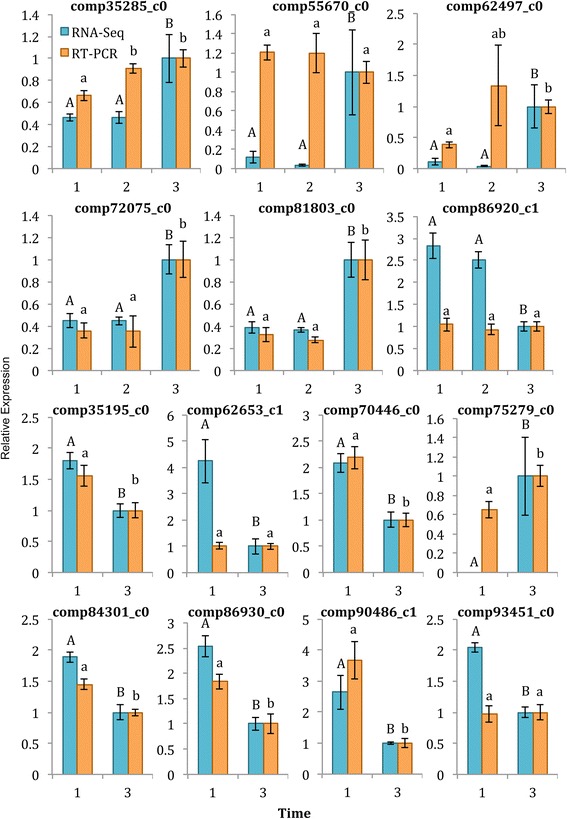
Fig. 4.

Validation of 14 differentially expressed transcripts using qRT-PCR. Transcript expression in node 2 rms5-3 axillary buds was calculated relative to time window 3 for both RNA-seq data (blue bars) and qRT-PCR data (orange bars). Only time windows that were statistically significantly different in the RNA-seq edgeR analysis were included. Data are means ± SE (n = 3–4 pools of ~60 plants). Statistically significant differences were determined using a one-way ANOVA with a post-hoc Tukey’s test. Different letters (capital letters for RNA-seq values, lower case letters for qRT-PCR values) represent statistically significant differences at FDR<0.05 or p < 0.05, respectively
