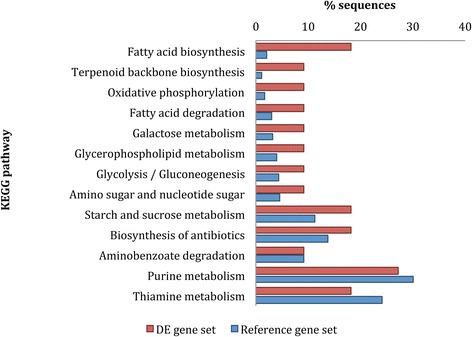
Fig. 6.

KEGG pathways represented in the differential expression analysis, ordered according to fold change difference between the percentage of genes annotated in the DE gene set (red) and the reference gene set (blue). The longest isoform for each transcript in the transcriptome was used in the analysis
