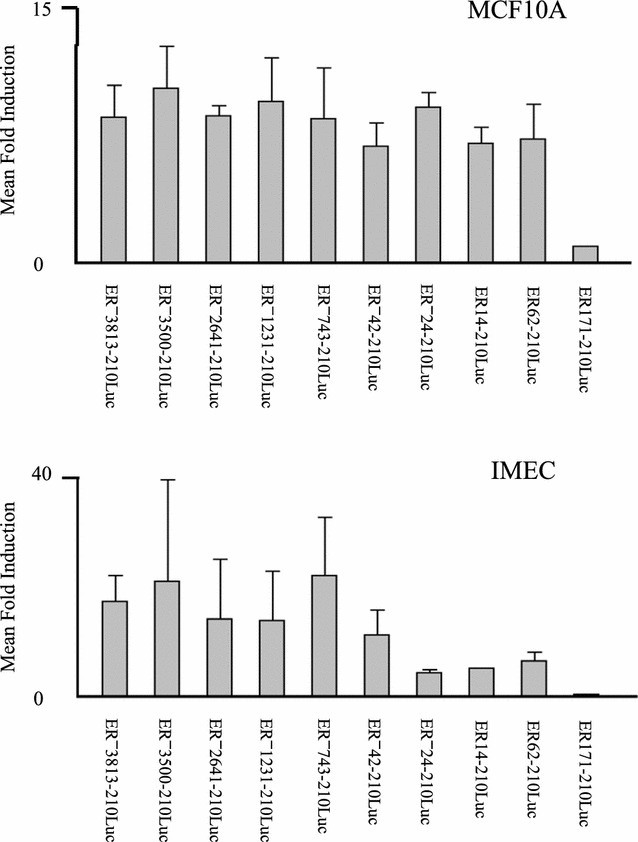
Fig. 4.

Localization of the segment of ER promoter mediating transactivation by BRCA1. Mean fold induction in luciferase activity (y axis) by BRCA1 in MCF10A cells (top panel) and IMEC cells (bottom panel) is indicated for all ER promoter constructs (x axis), calculated as the ratio of promoter activity when co-transfected with BRCA1, divided by promoter activity measured with co-transfection of pRK7. Standard error of the mean is indicated
