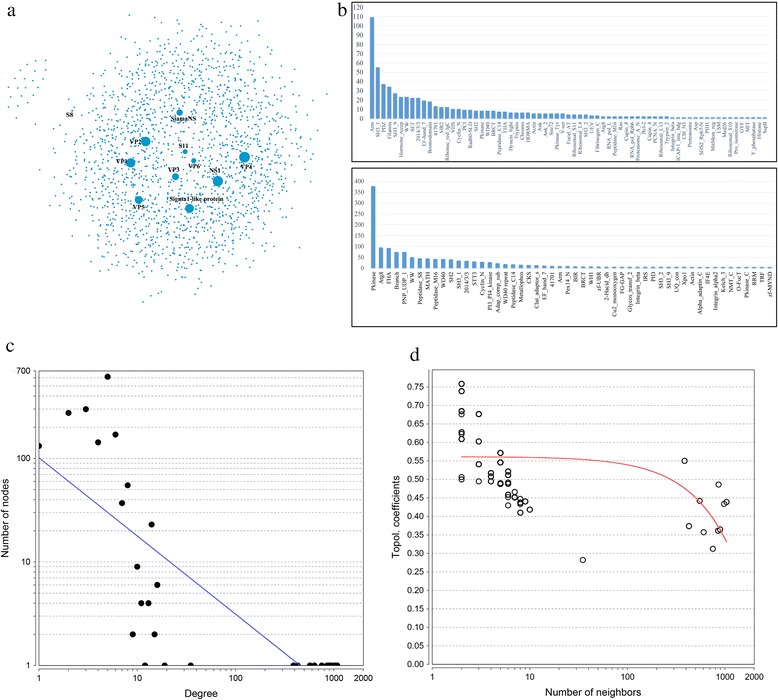
Fig. 2.

Characteristics of GCRV virus-host protein interaction network. a GCRV virus-host protein interaction network, the node represents proteins, the line links the nodes, is colored as light grey. The node size is proportional to the number of degree. b Frequencies distribution of domains targeted by virus GCRV proteins. The y axis represents number of frequency of domain, and the x axis represents domain name. The above one depicts the distribution of domains that predicted based on 3did database, and the below one depicts the distribution of domains that predicted based on iELM database. c Node degree distribution of predicted GCRV-host PPIs network. The x axis represents number of degree, and the y axis represents number of node. d Topological coefficients of predicted GCRV-host PPIs. The x axis represents number of neighbors, and the y axis represents topological coefficients
