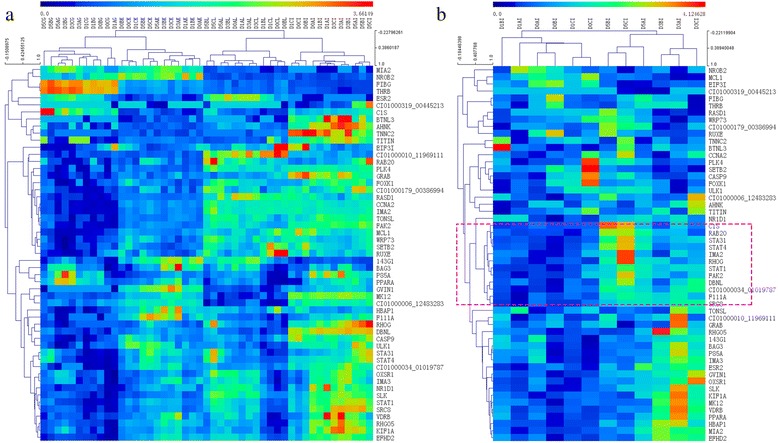
Fig. 5.

Expression patterns of DEGs that targeted by GCRV. a Hierarchical cluster analysis of significant DEGs expression profiles from four tissues with three replicates at the four time points after (0 h, 1 h, 3 h, 5 h) GCRV challenge. b Hierarchical cluster analysis of significant DEGs expression profile of intestine. The color is proportional to the expression level, which was subjected to log2 ratios transformation. The x axis represents different samples, and the y axis represents gene symbols. We named one sample by four letters, the first letter ‘D’ means ‘DEGs’, the second letter means the replicate Number (A, B, C), the third letter means the time point (0 h, 1 h, 3 h, 5 h), the fourth means the tissue, G, I, L, K represent gill, intestine, liver, head kidney independently. Take ‘D5CI’ for example, it means DEGs from the third replicate sample of intestine after 5 h GCRV challenge
