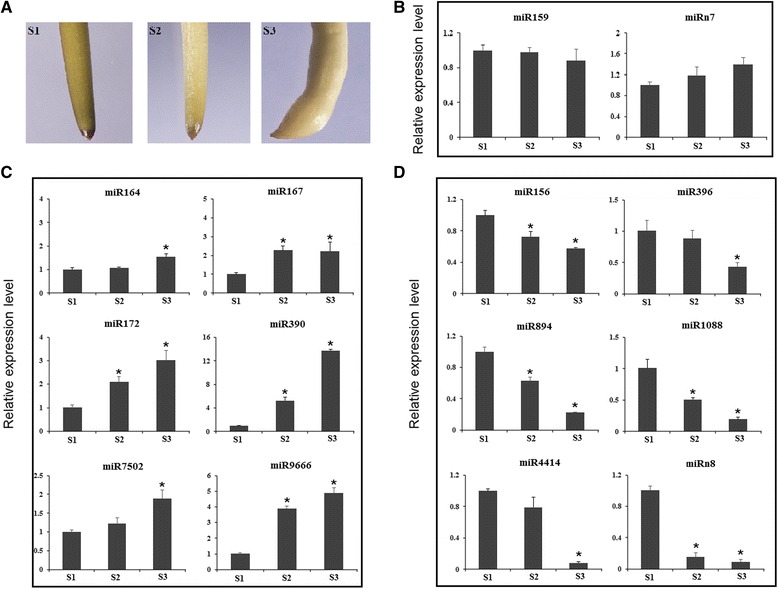
Fig. 3.

Expression analysis of pod development-related miRNAs using qRT-PCR. a Phenotype of gynophore in S1, S2 and S3. b MiRNAs with similar expression level at S1, S2 and S3 gynophores. c Up-regulated miRNAs during pod development. d Down-regulated miRNA during pod development. Error bars indicate SD of three biological replicates. Asterisk indicated a statistically significant difference (P < 0.05)
