
Fig. 6.
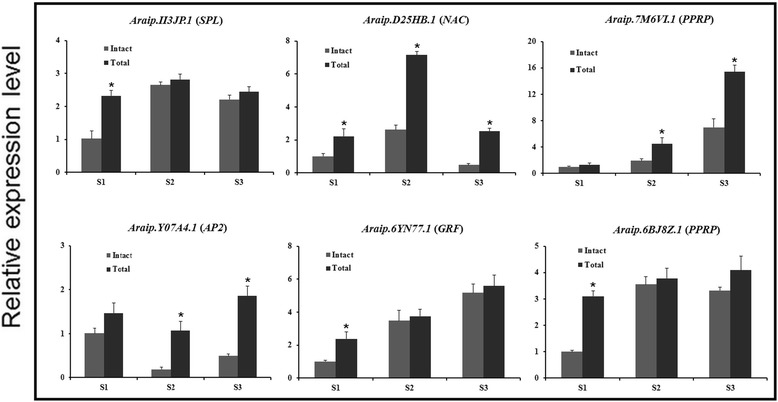
qRT-PCR analysis of total and intact mRNA levels in peanut gynophore using two different primers sets. Error bars indicate the SD of three biological replicates. The asterisk indicated a statistically significant difference (P < 0.05)
Official websites use .gov
A
.gov website belongs to an official
government organization in the United States.
Secure .gov websites use HTTPS
A lock (
) or https:// means you've safely
connected to the .gov website. Share sensitive
information only on official, secure websites.
qRT-PCR analysis of total and intact mRNA levels in peanut gynophore using two different primers sets. Error bars indicate the SD of three biological replicates. The asterisk indicated a statistically significant difference (P < 0.05)