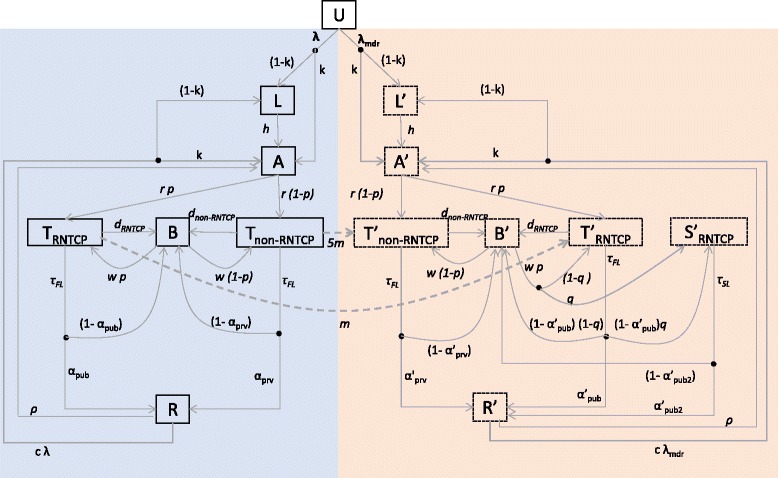
Fig. 1.

Summary of the compartmental model structure. The left-hand side of this figure corresponds to drug-sensitive TB, while the right-hand side (having compartments labelled with dashes) corresponds to multi-drug-resistant (MDR) TB. The population is divided into different compartments, representing states of disease and care seeking, with flows between compartments given by the rates shown in the diagram (see also Table 1). Concentrating on the left-hand side for illustration, uninfected individuals (U), upon acquiring infection, either enter a state of latent infection (L) or develop pre-treatment active disease (A). The rate r denotes the delay between the start of infectious symptoms and the first TB treatment initiation. We allow here for first-line treatment initiation either under non-RNTCP (T non-RNTCP) providers or under RNTCP (T RNTCP). From either sector a certain proportion of patients may default or fail treatment without being retained in care (B): these patients subsequently seek care again after a given delay. Each of these stages carries a per-capita TB mortality rate, estimated from the literature as described in the main text. Finally, individuals may be cured either through treatment or spontaneously (R). The right-hand side of this figure has slightly more complexity to account for different pathways for MDR diagnosis: these include drug resistance being recognized at the point of TB diagnosis; after non-response to first-line treatment; or not at all. The compartment S'RNTCP denotes MDR-TB patients who are receiving second-line treatment in RNTCP. Further details and model equations are shown in Additional file 1. For clarity, the figure omits exogenous reinfection (which moves individuals from R to L and I, in the same ratios as from U) and relapse (which moves individuals from R to I)
