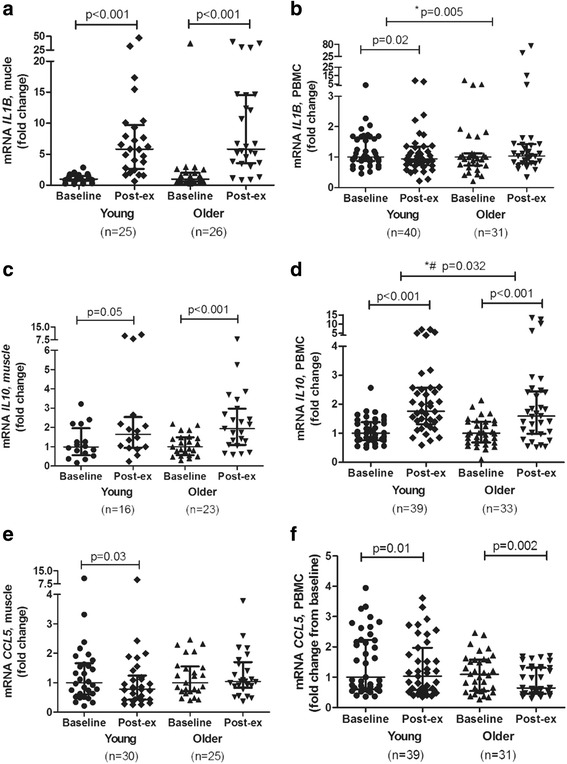
Fig. 5.

mRNA expression levels of IL1β (a, b), IL10 (c, d), and CCL5 (e, f) after an acute bout of strength exercise, expressed as fold changes, in young and older subjects in skeletal muscle and PBMC. Skeletal muscle (young people); n = 16 (c), n = 25 (a), and n = 30 (e). Skeletal muscle (older subjects); n = 23 (c), n = 25 (e), and n = 26 (a). PBMC (young subjects); n = 39 (d, f) and n = 40 (b). PBMC (older subjects); n = 31 (b, f) and n = 33 (d). Data are shown as median and interquartile ranges. *Indicates differences between young and older subjects. #Indicates differences at baseline between young and older participants
