Fig. 2.

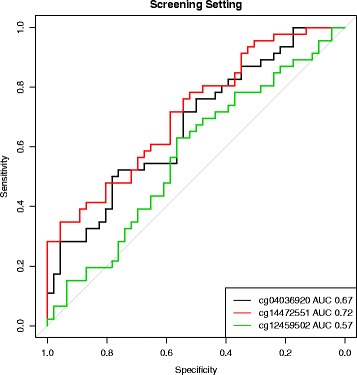
Single marker performance in screening setting. ROC curves of the three markers after correction of β-values for leukocyte composition and batch effects

Single marker performance in screening setting. ROC curves of the three markers after correction of β-values for leukocyte composition and batch effects