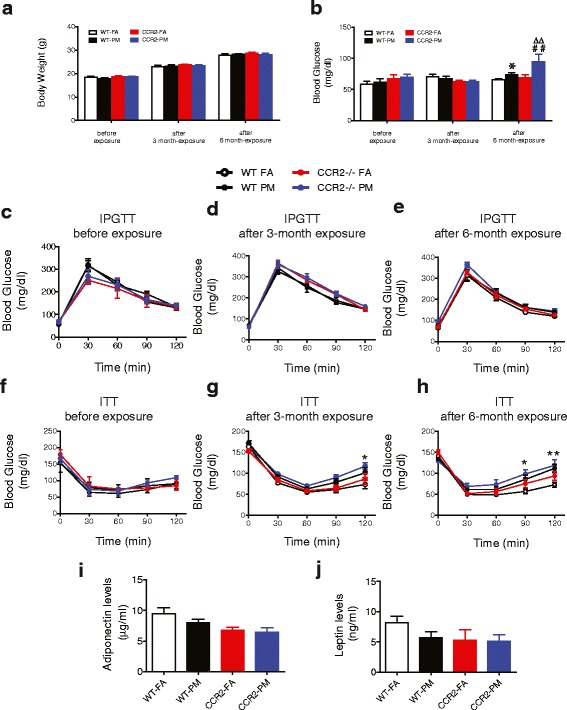
Fig. 2.

Effect of PM2.5 exposure on glucose homeostasis in WT and CCR2-/- mice. a, Body weight of mice at baseline, at the end of 3 and 6-months exposure to PM2.5 or FA. b, Fasting blood glucose at baseline, at the end of 3 and 6-months exposure to PM2.5 or FA. c-e, Intraperitoneal glucose tolerance test (IPGTT) in overnight fasted mice (c) before, (d) at the end of 3-months, and (e) at the end of 6-months PM2.5 exposure. f-h, Insulin tolerance test (ITT) in 4.5 h fasted mice (f) before, (g) at the end of 3-months, and (h) at the end of 6-months PM2.5 exposure. i-j, Plasma adiponectin (i) and leptin (j) levels at the end of PM2.5 exposure. *P < 0.05, ** P < 0.01, *** P < 0.001 when WT-PM compared to WT-FA group; ## P < 0.01 when compared CCR2-PM to WT-PM group; ∆∆ P < 0.01 when compared CCR2-PM to CCR2-FA group. n = 5–10 per group
