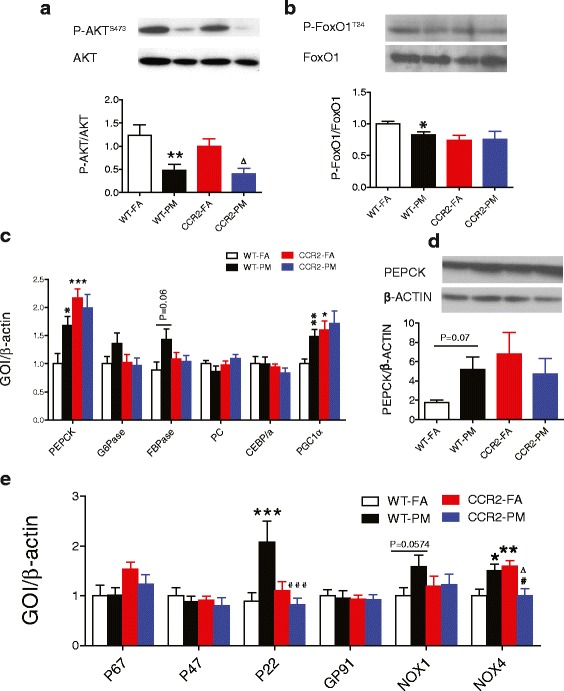
Fig. 5.

Effect of PM2.5 exposure on insulin signaling pathway, gluconeogenesis-related molecules and expression of NADPH oxidase subunits in liver from WT and CCR2-/- mice. a-b, Representative bands and analysis of western blotting for (a) phosphorylated (P-AKT)/total AKT and (b) phosphorylated (P-FoxO1)/total FoxO1 in the liver. c, mRNA levels of PEPCK, G6Pase, FBPase, PC, CEBPα and PGC1α in the liver of mice. d, Protein levels of PEPCK in the liver. e. Gene expression of NADPH oxidase subunits in the liver. *P < 0.05, **P < 0.01, ***P < 0.001 compared to WT-FA group; #P < 0.05, ###P < 0.001 when CCR2-PM compared to WT-PM group; ∆ P < 0.05 when compared CCR2-PM to CCR2-FA group. n = 5–7 per group for western blotting and n = 6–9 per group for gene expression
