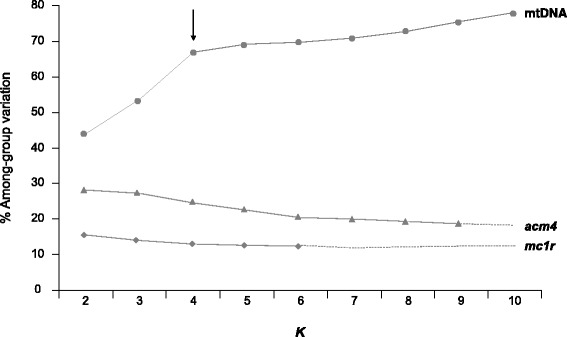
Fig. 4.

Summary of results of the spatial analysis of molecular variance (SAMOVA) analyses of the sampled populations of Podarcis tiliguerta for each locus. The percentage of variation explained by the among-group level of variation is reported for the best-clustering option at each pre-defined value of K (the number of groups). The arrow shows the best clustering option obtained for the mtDNA dataset, whereas SAMOVA analyses based on nuclear (mc1r and acm4) dataset do not allow identifying a population grouping best explaining the data. Dashed lines represent values of K for which fixation indexes were not significant
