Fig. 2.

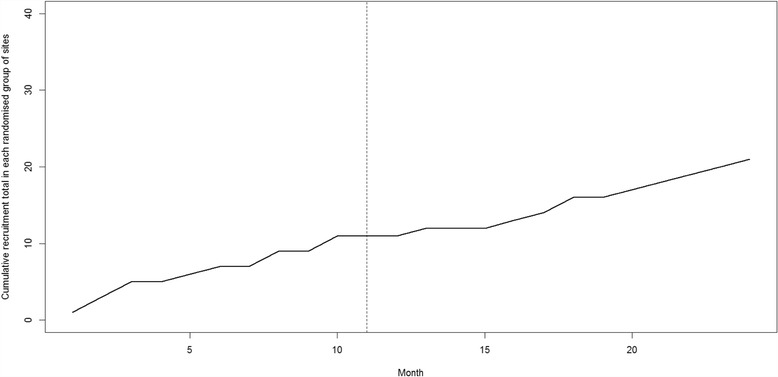
Example of the line plot that will be drawn to show changes in cumulative recruitment rate over time in each randomised group of sites (this plot does not contain any real data)

Example of the line plot that will be drawn to show changes in cumulative recruitment rate over time in each randomised group of sites (this plot does not contain any real data)