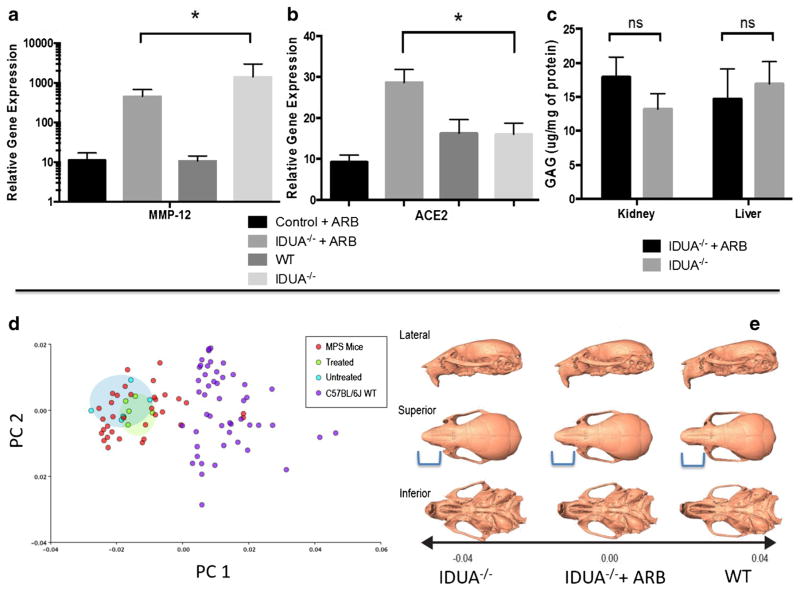
Fig. 2.
Quantitative gene expression and glycosaminoglycan storage analysis. Group 4 (juvenile) IDUA−/− mice (treated, n = 6 or untreated, n = 5 with losartan) were analyzed by qRT PCR for a MMP-12 and b ACE2 with normalization to GAPDH with untreated IDUA−/− animals in the cohort serving as the reference. p = 0.023 for MMP-12 and p = 0.010 for ACE2 (Student’s t-test). c GAG measurement. The liver and kidney of each animal was harvested for GAG measurement and is shown as micrograms of GAG per milligram of tissue. Standard error of the mean is shown and ns = not statistically significant. p = 0.277 for kidney and 0.725 for liver (Student’s t-test). Geometric morphometric analysis of three-dimensional craniofacial shape. d Principal components (PC) plot showing variation within and among the untreated IDUA−/− group controls (red dots), C57Bl/6 WT (purple dots), age and sex matched losartan treated (green dots) or untreated IDUA−/− (light blue dots) groups analyzed. For craniofacial shape e 3D morphs showing the shape variation along principal component 1. From left to right are representative images of untreated or losartan treated IDUA−/− or WT mice. Blue bracket indicates the region of the skull that was normalized by losartan

