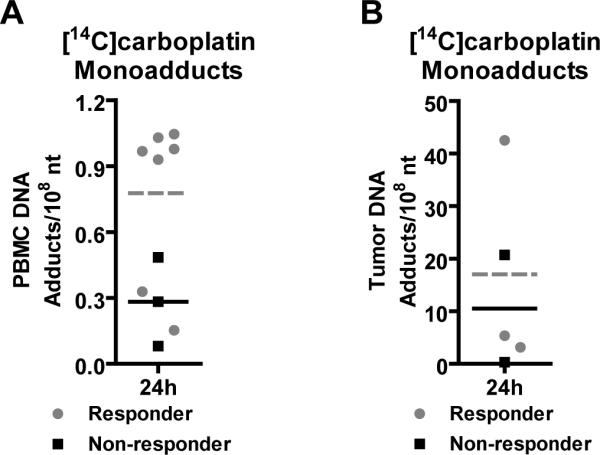
Figure 2. Correlation of microdose-induced [14C]carboplatin-DNA adduct levels to therapy response.

Carboplatin-DNA monoadduct levels were quantified in patient A) PBMC and B) tumor biopsy tissue 24 h after receiving one microdose of [14C]carboplatin (grey circular symbols = responder, grey dashed line = responder mean adduct level, black symbols = non-responders, black solid line = non-responder mean adduct level). Student's t-test was used to measure all p values (p<0.001 for high adduct level group compared to the low adduct level group, and p = 0.069 for differentiating responders and nonresponders). Each data point represents a value for an individual patient.
