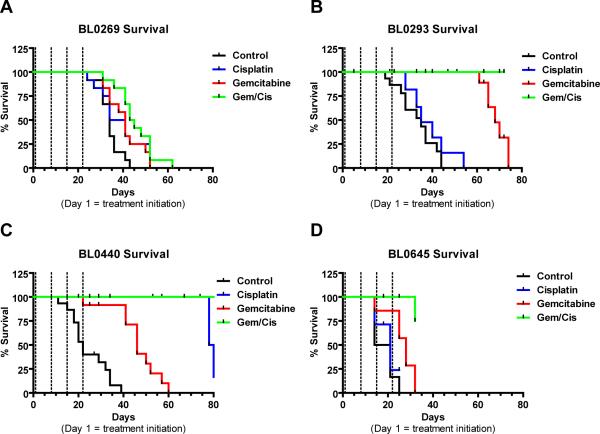
Figure 3. Tumor specific survival after chemotherapeutic treatment of NSG PDX mice bearing four different bladder cancer xenografts.
Kaplan-Meier survival curves comparing different treatments (N ≥ 8) of A) BL0269, B) BL0293 C) BL0440 and D) BL0645. Black line = Vehicle (D5W IV Q7Dx3), blue line = cisplatin (2 mg/kg IV Q7Dx3), red line = gemcitabine (150 mg/kg IP Q7Dx4), green line = G/C combination chemotherapy (dashed lines represent treatment days).

