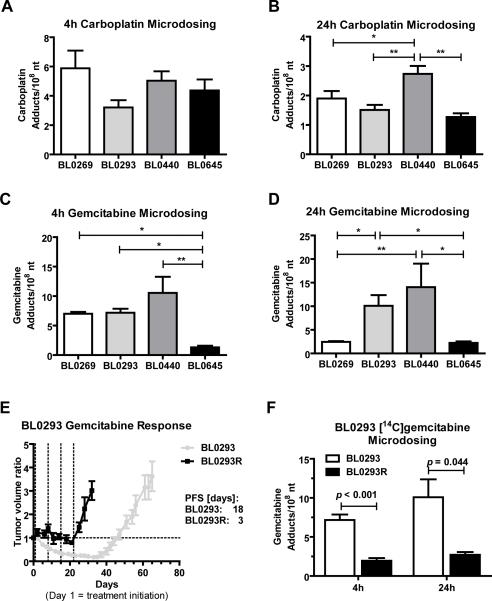
Figure 4. Microdose-induced carboplatin- and gemcitabine DNA-adduct levels correlate with PDX drug sensitivity.
NSG mice were implanted with the indicated PDX tumors 14 to 30 days before microdosing. Animals (N ≥ 4 per group) were dosed via tail vein injection with A and B) 0.375 mg/kg carboplatin, 50,000 dpm/g or C, D and F) 0.092 mg/kg gemcitabine, 1000 dpm/g. Tumors were collected after A and C) 4h or B and D) 24h and 14C content of isolated tumor DNA was analyzed via AMS. E) Tumor volume ratio of parental PDX model BL0293 (grey line) and resistant model BL0293R (black line). BL0293 was defined as resistant after gemcitabine treatment did not affect tumor growth (8 cycles). Dashed lines represent treatment days. F) Microdose-induced gemcitabine adduct levels at 4h and 24h of BL0293 and BL0293R. One-Way ANOVA with Newman-Keuls post hoc test or Student's t-test was used to measure all p values (* p < 0.05, ** p < 0.01). Presented are means and error bars represent SEM.

