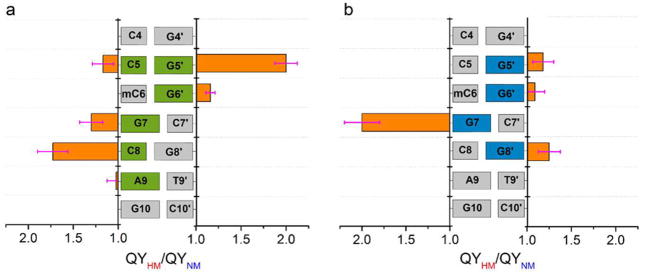
Figure 4.
Relative QY changes on binding of SRA to HM and NM duplexes labeled by (a) 3HCnt or (b) thG. QYHM/QYNM corresponds to the ratio of the QY of 3HCnt/thG in the SRA/HM-duplex complex to that in the SRA/NM-duplex. Concentration of labeled duplexes was 1 μM, while the SRA concentration was chosen to complex at least 80% of the DNA molecules (Tables S5 and S6). Data are expressed as means ± standard deviation for n = 5 independent experiments. Experiments were done in phosphate buffer 20 mM, NaCl 50 mM, TCEP 2.5 mM, 1 mM EDTA, PEG 0.05%, pH 7.5, at T = 20 °C.

