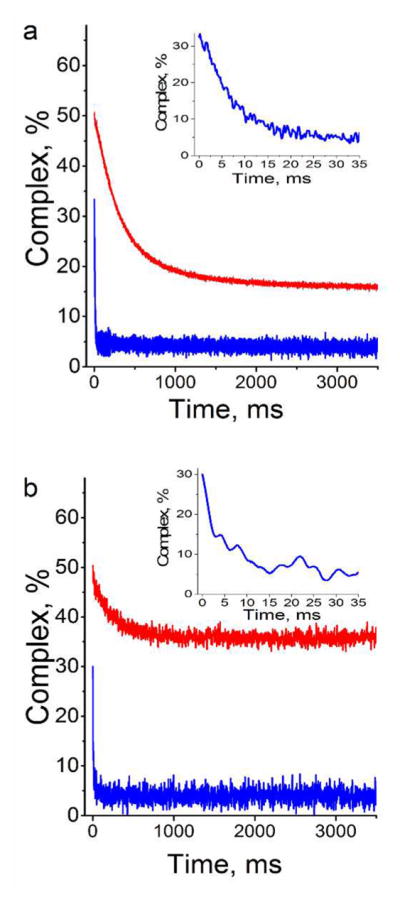
Figure 7.

Dissociation kinetics of the complexes of SRA with HM (red) and NM (blue) duplexes labeled with (a) 3HCnt at position 5′ and (b) thG at position 7. The kinetics traces were recorded by stopped-flow after addition of an excess of ctDNA to the complexes. The concentration of HM or NM duplexes was 0.3 μM. The SRA concentration was (a) 3.6 μM, 0.6 μM and (b) 0.6 μM, 0.3 μM for NM and HM DNA, respectively. Here, the protein concentrations were chosen to ensure ~50% of binding. The concentration of ctDNA was 600 μM, as expressed in nucleotides. The measured fluorescence intensity was converted in percentage of labeled duplexes bound to SRA. Inset: Highlight of the kinetic trace recorded with the labeled NM duplex during the first 60 ms. The buffer was that same as that in Figure 2.
