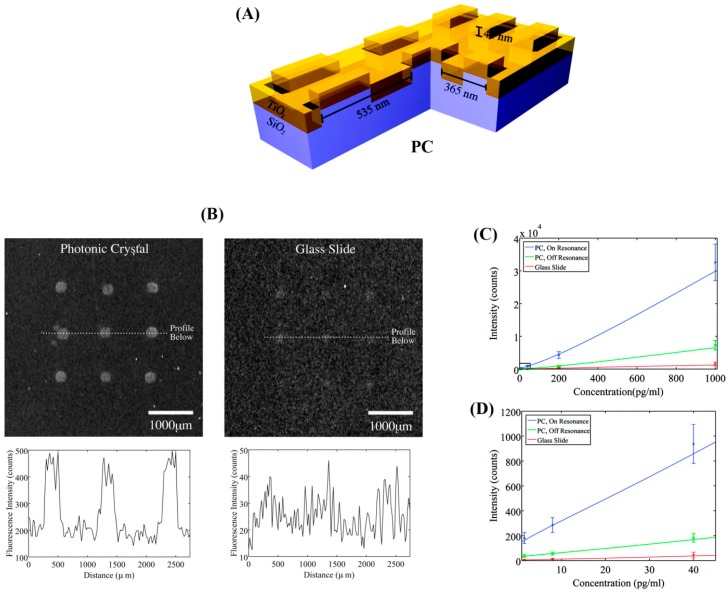
Figure 10.
(A) The layout of the SiO2/TiO2 PC platform fabricated using a nanoreplica molding process; (B) Fluorescence data obtained from an identical immunoassay performed using a PC and a glass slide. The fluorescence images and the corresponding intensity profiles show that the SNR of the fluorescence assay is about 8 times higher than the ratio from the glass slide assay; (C) Net fluorescence intensity as a function of TNF-α concentration for the immunoassay performed on the PC on-resonance, the PC off-resonance, and the glass slide; (D) The lower concentration data in (C) are magnified to clearly display the results of the three lowest assay concentrations. Reproduced with permission from Ref. [91] Copyright (2008) American Chemical Society.

