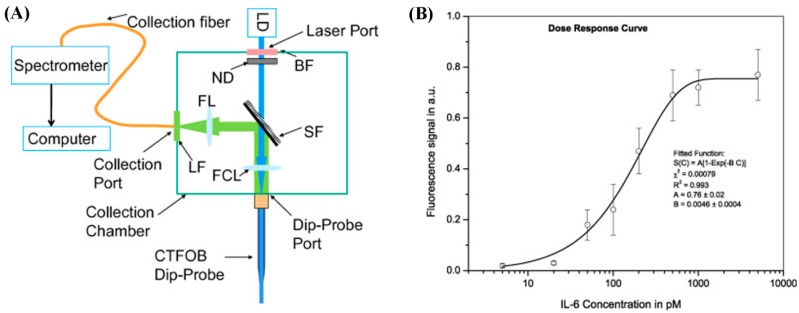
Figure 22.
(A) A diagram of the CTFOB measurement setup is shown. LD, BF, ND, SF, FL, LF, and FCL denote the laser diode, band pass filter, neutral density filter, short pass filter, focusing lens, long pass filter, and focusing-collecting lens, respectively; (B) A dose-response curve is generated from the average fluorescence signal of various IL-6 concentrations. Reproduced with permission from Ref. [151] Copyright (2009) Elsevier.

