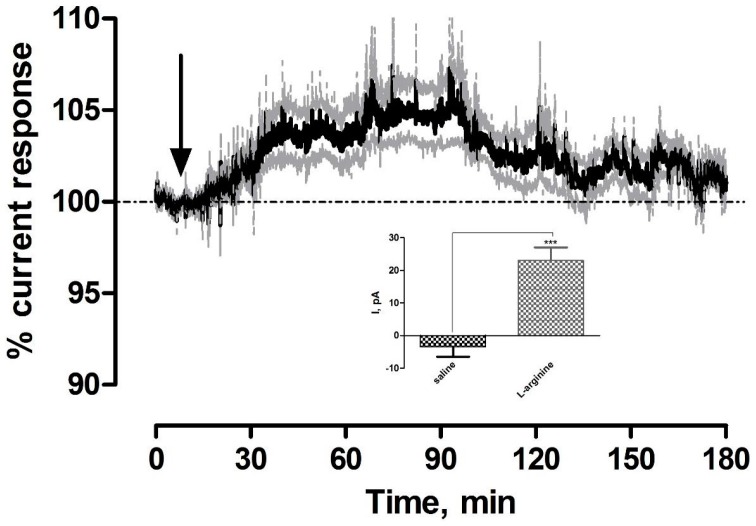
Figure 3.
Averaged raw data % current response of NO sensors implanted in the striatum of NOD SCID mice to a 200 mg·kg−1 injection of l-arginine (n = 5). Arrow indicates point of injection. Mean % current response represented by black trace, % error represented by grey trace. Inset: Comparison of ΔI for saline control vs. l-arginine (p < 0.001), unpaired t-test (n = 5). Data represented as ΔI ± SEM as compared to baseline. * denotes level of significance

