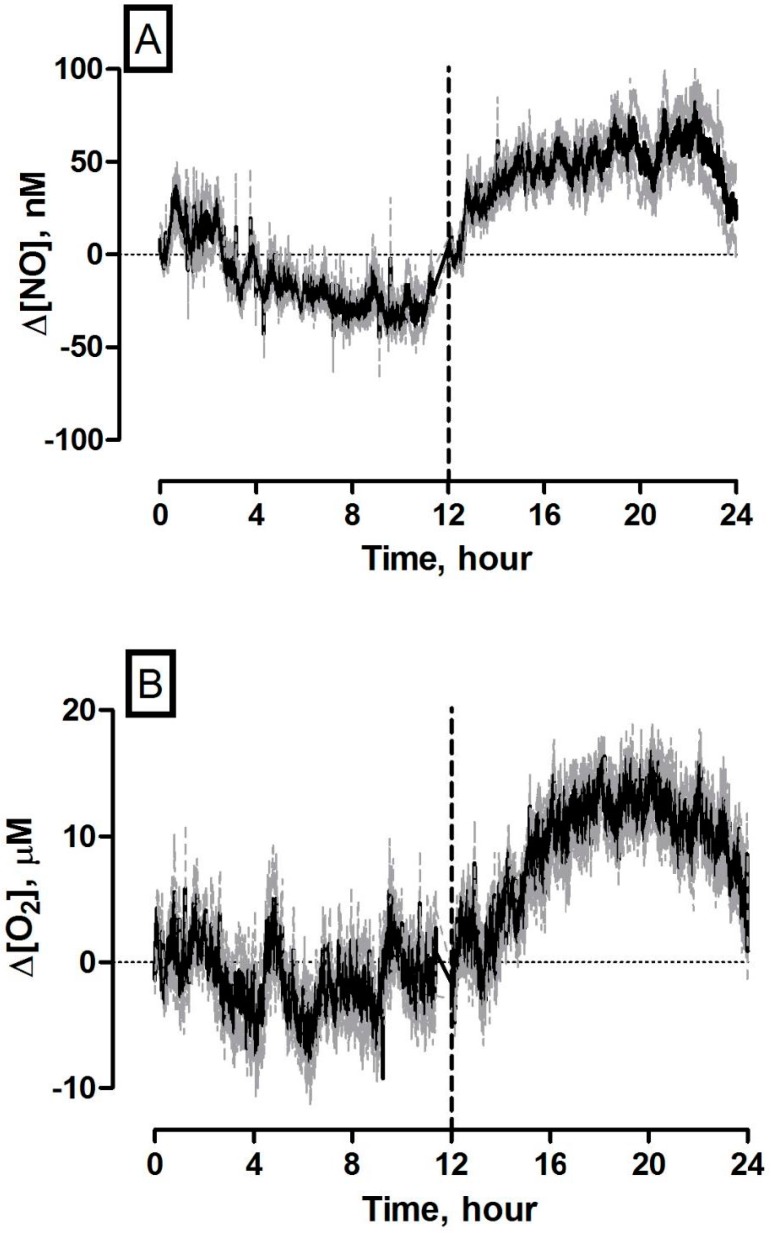
Figure 6.
Averaged 24 h concentration dynamics measured using (A) NO and (B) O2 sensors implanted in the striatum of NOD SCID mice. Mean concentration represented by black trace, error represented by grey trace. 0–12 h represent light phase (07.00–19.00) and 12–24 h represent dark phase (19.00–07.00). Vertical dashed line signifies end of light phase/start of dark phase.

